
Background
The cropping region in Southwestern NSW has evolved dramatically in the last one-two decades. Traditionally cropping practices were highly conservative with one-two seasons of mechanical fallow between cereal crop phases before these rotations moved towards continuous cropping with cereal crops during the 2000’s. This led to major gains in water use efficiency and environmental benefits from improvements in groundcover, however this system was not sustainable with the eventual development of agronomic issues such as brome grass and declining fertility.
Over the past decade, there has been a further refinement in paddock rotations with the adoption of more diverse rotations. Legume crops such as lentils, chickpea, field pea and vetch have become an important component of regional crop sequences and the added nitrogen (N) supply from these enterprises is providing significant vigour and yield benefits to subsequent cereal crops.
Despite the obvious benefits from improved N supply, most farmers are reluctant to apply additional N inputs from inorganic fertiliser inputs. Therefore, the question remains as to if further productivity gains can be achieved, particularly in better rainfall seasons, with improved N supply over and above what is supplied through the organic N sources from legumes. Furthermore, while pulse crops can fix considerable quantities of N, significant quantities of N are also removed through products such as hay and grain. Therefore, additional N fertiliser inputs may be required to prevent N being mined from the soil organic N pool.
About the trial
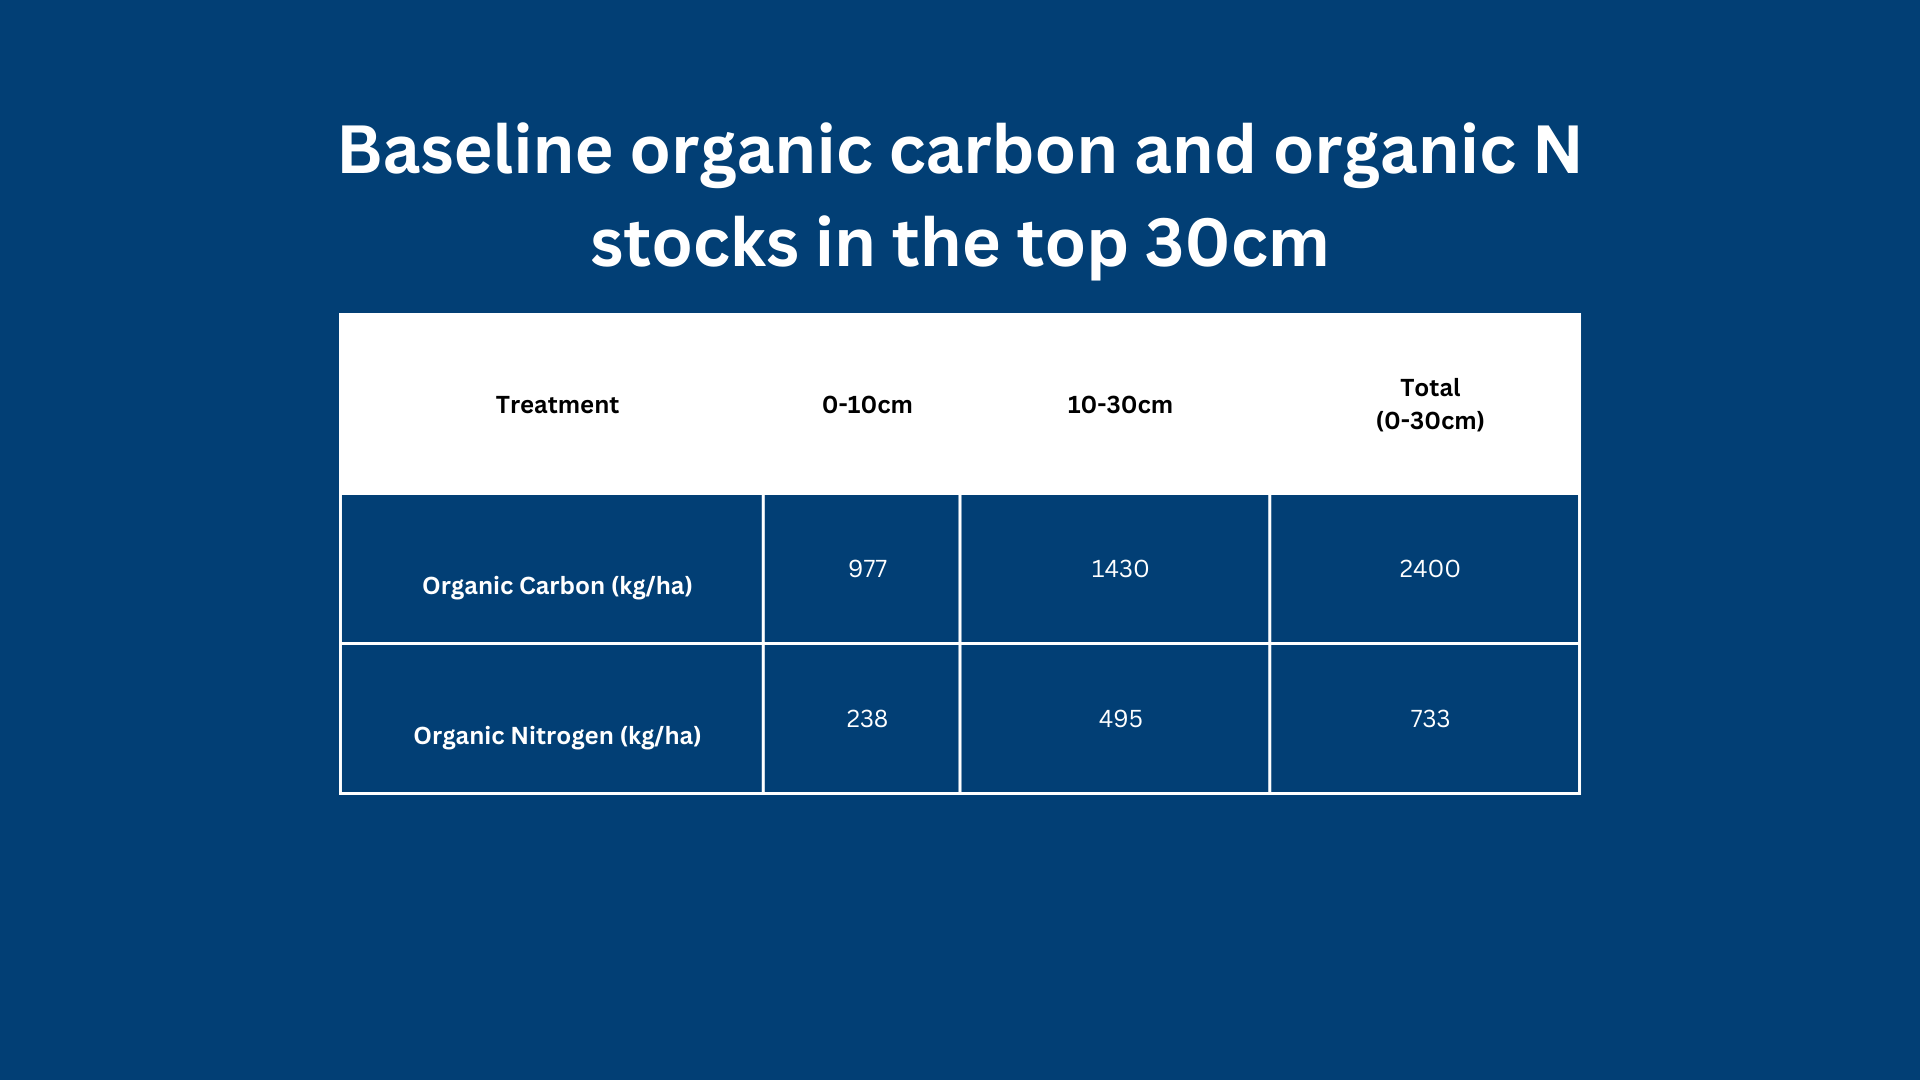
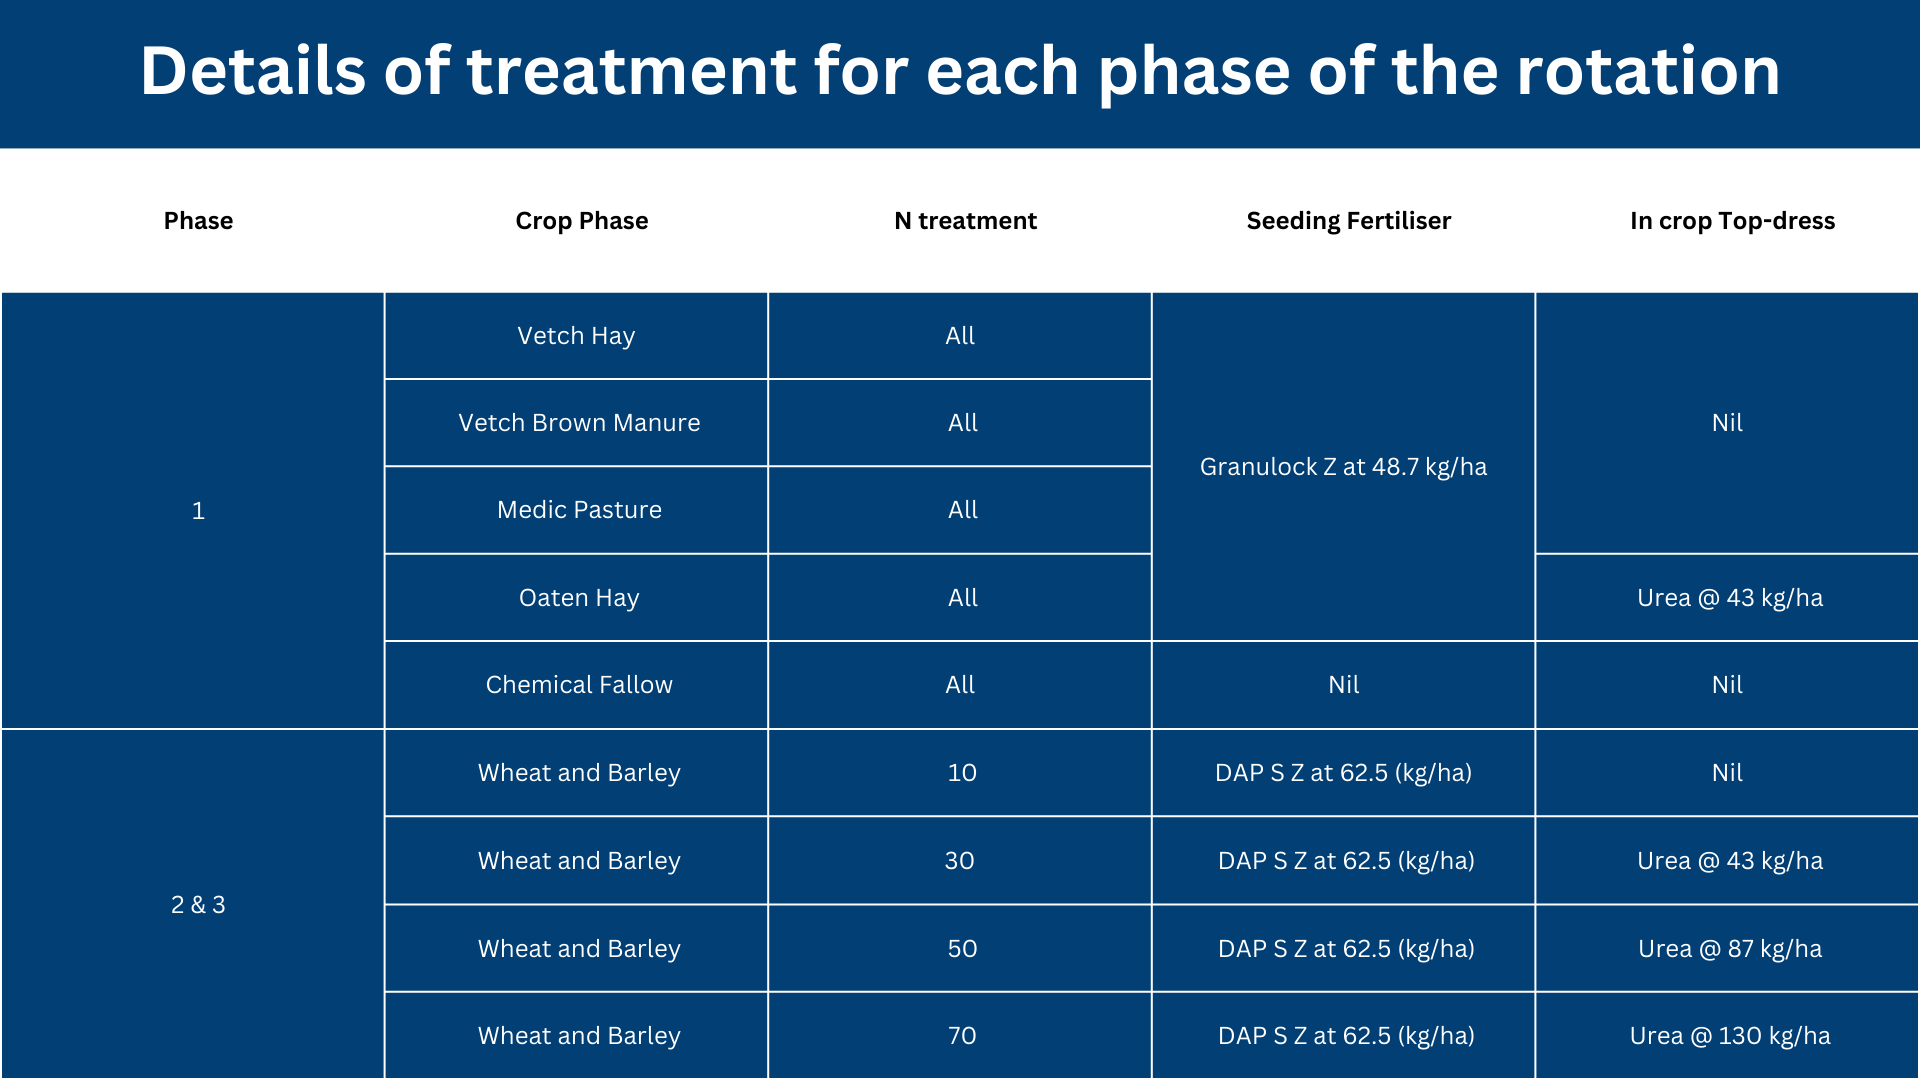
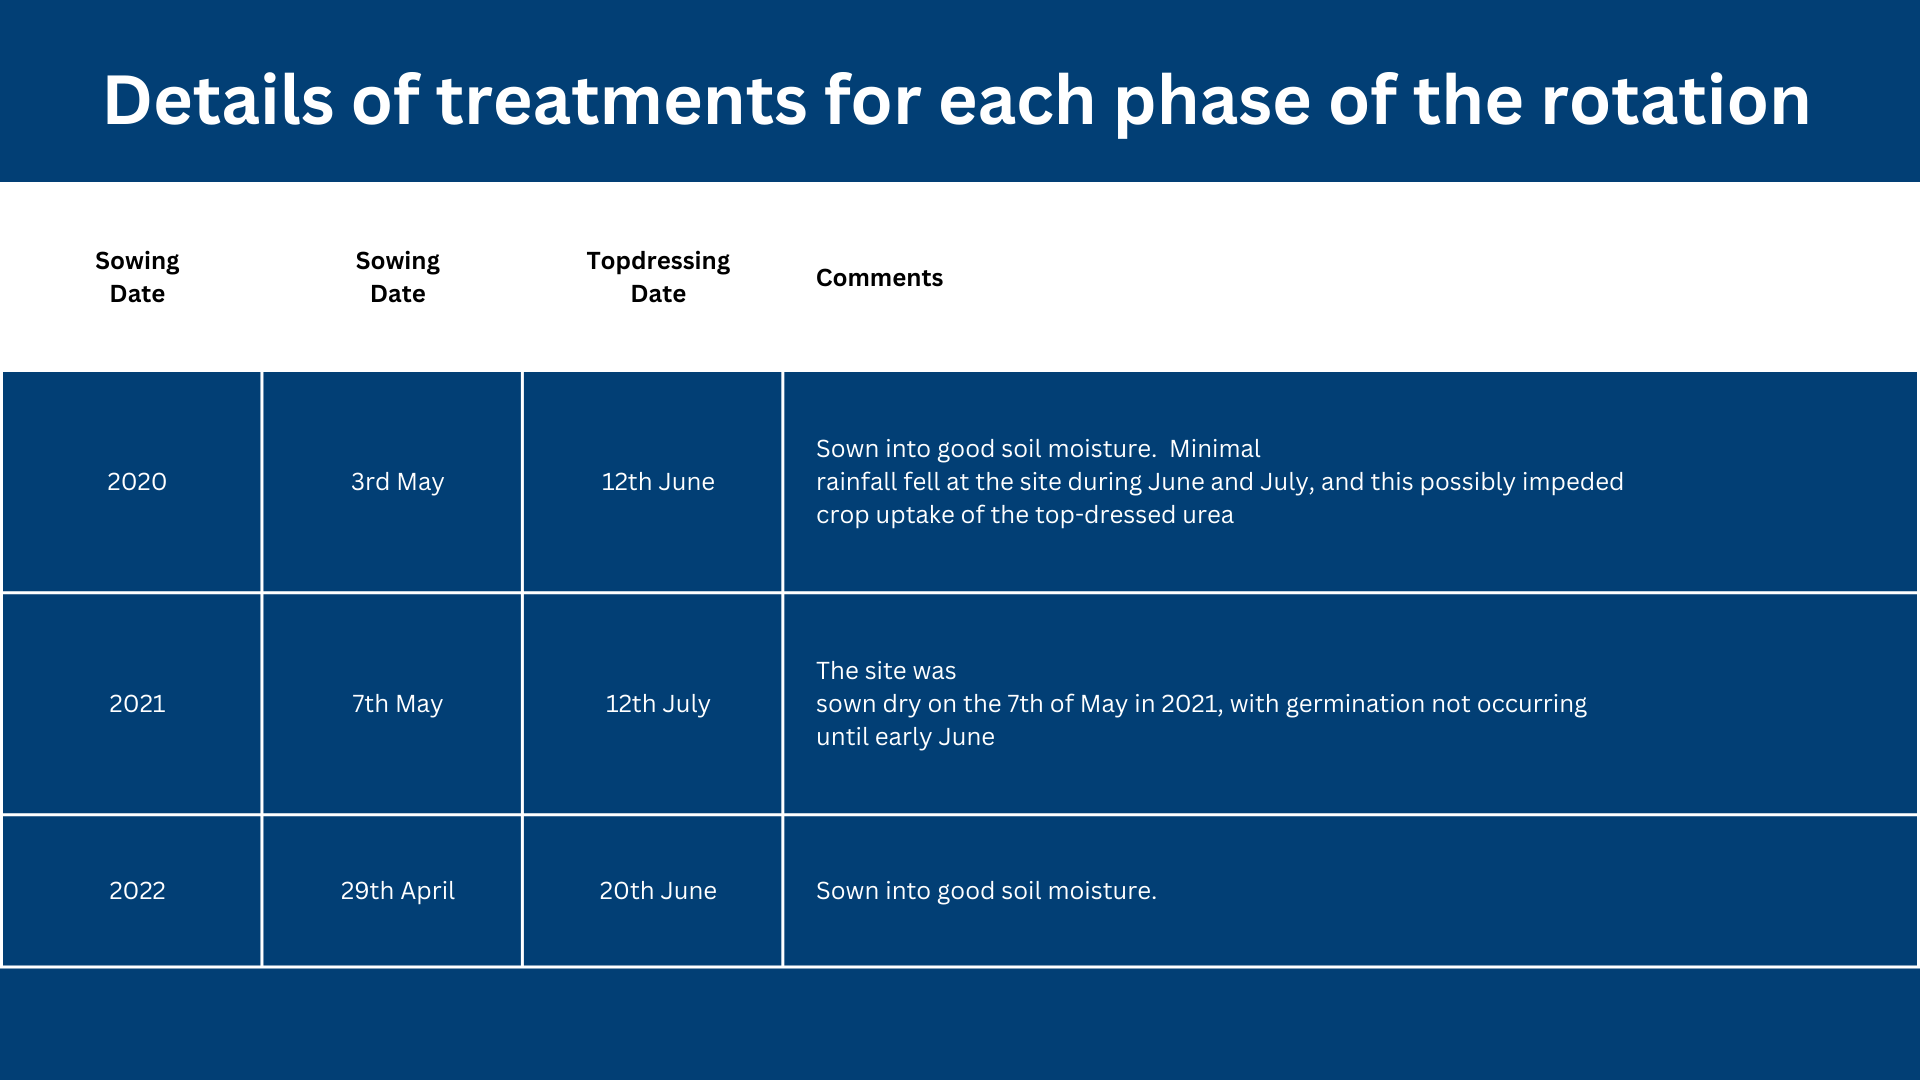
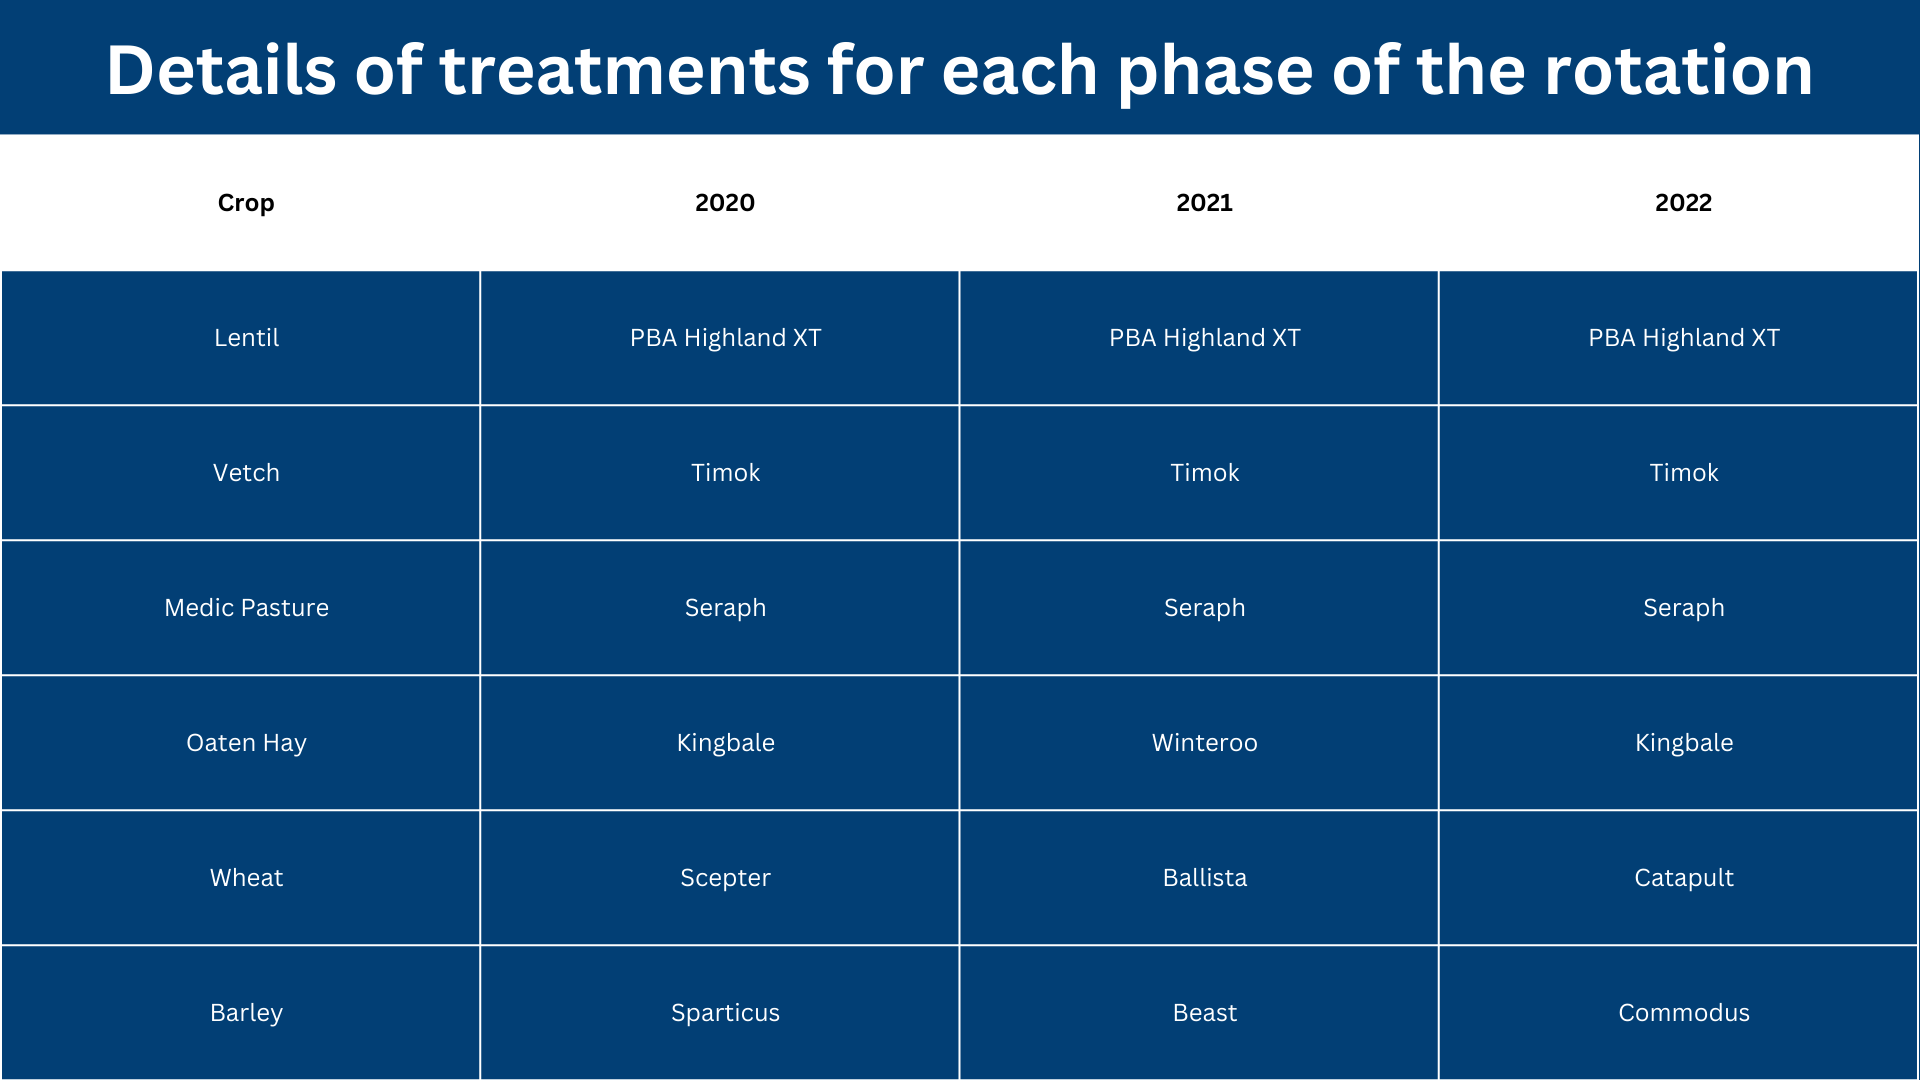
The trial site is located at Gol Gol in South Western NSW. The site has a sandy and alkaline soil with key properties shown in Table 1. Soil organic carbon and nitrogen stocks were characterised prior to commencement of the trials in 2020. As shown in Table 2, the top 30 cm of soil contains an organic carbon pool of 2400 kg/ha and a total nitrogen pool of 733 kg/ha. The site was divided into three sub trials with each planted to a different phase of a three-year rotation in each season (Table 3). Within the wheat and barley phases four different N rates were applied: 10, 30, 50, 70 kg N/ha (Table 3). Details of sowing times and varieties used in each season are provided in Tables 4 and 5.

Results & Discussion
Break Crop Phase
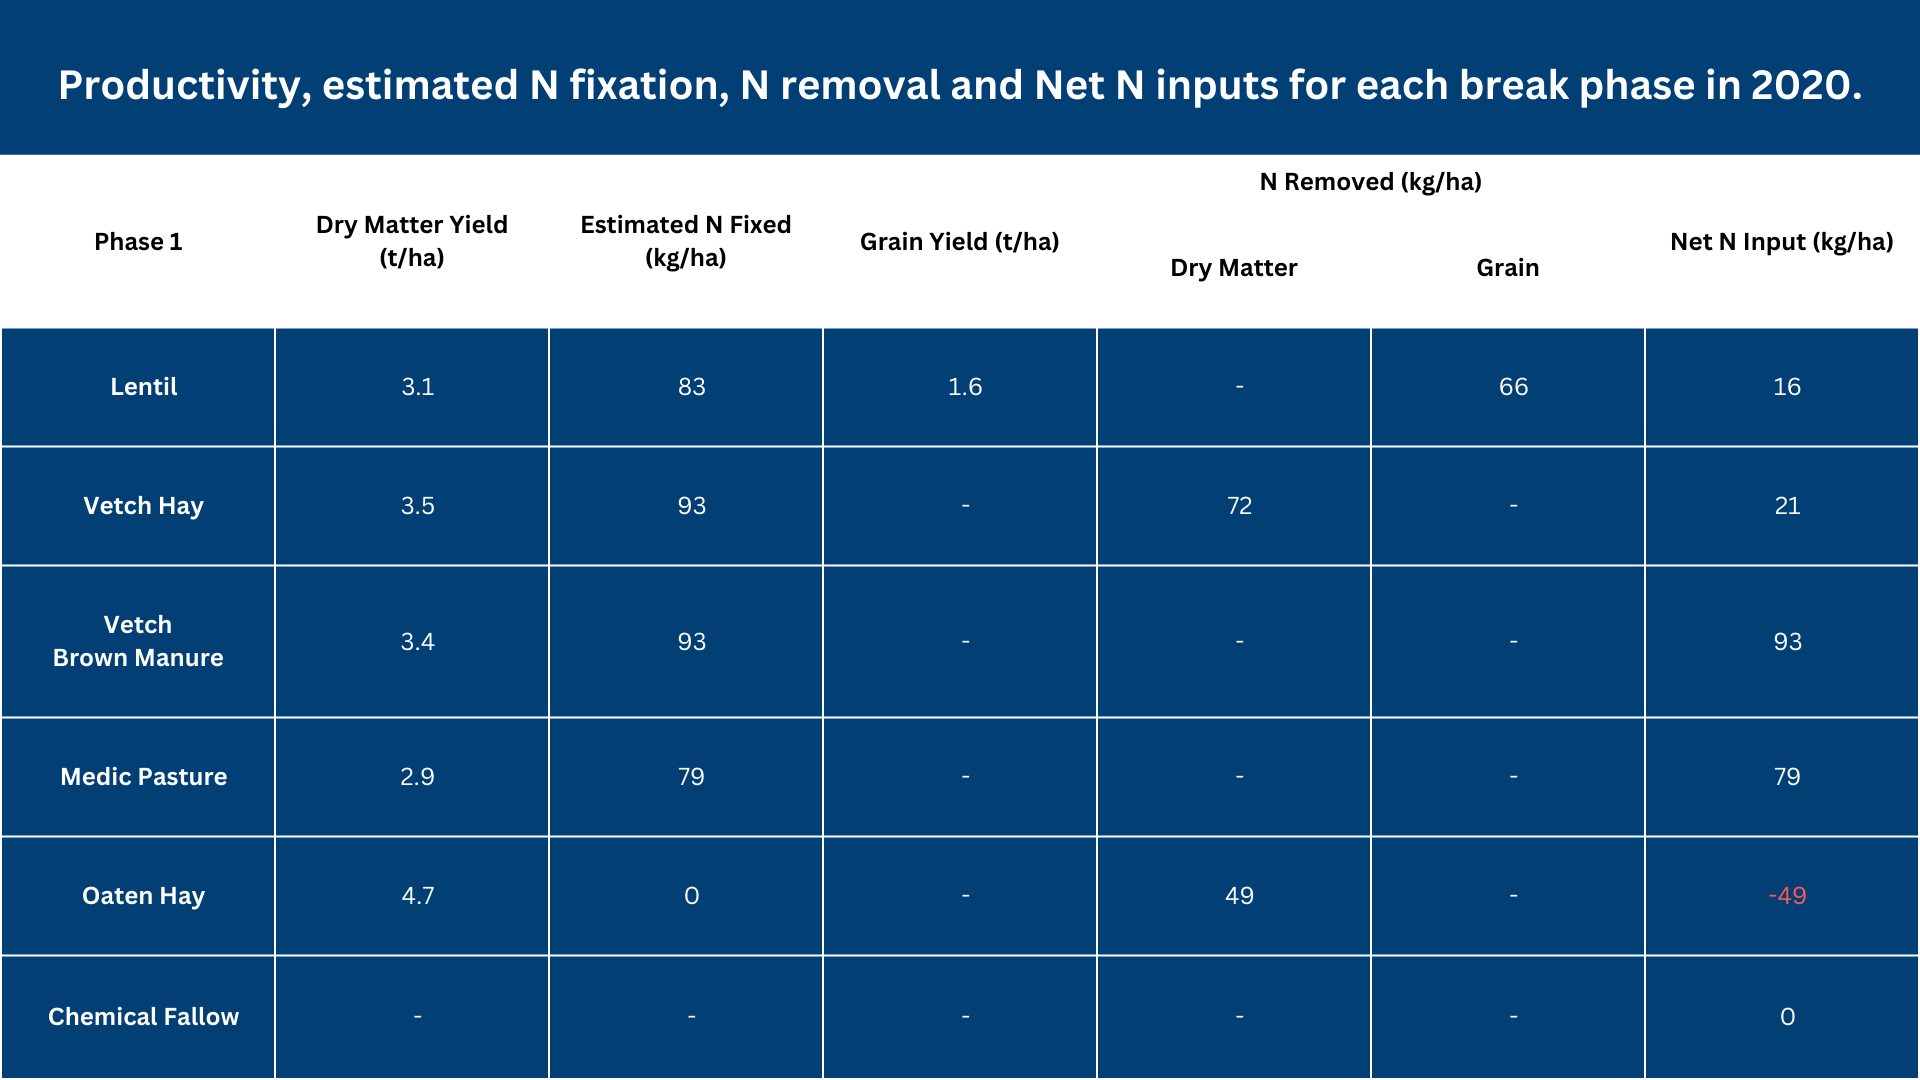
In 2020 all crops and pastures were sown into good moisture 3rd of May. Early establishment promoted good early growth of all legume crops which resulted in legume options producing 3 – 3.5 t/ha of biomass (Table 6). Assuming a N fixation rate of 18 kg N per ton of biomass grown and that an additional one third of the nitrogen is fixed by legume root systems, N fixation by the legume break phases was estimated at 90-100 kg N/ha. Lentil grain yield in 2020 was 1.6 t/ha. After accounting for N removed in hay and grain and N applied through fertiliser, net N inputs ranged from -47 kg N/ha for oaten hay to +93 kg/ha for brown manure vetch.
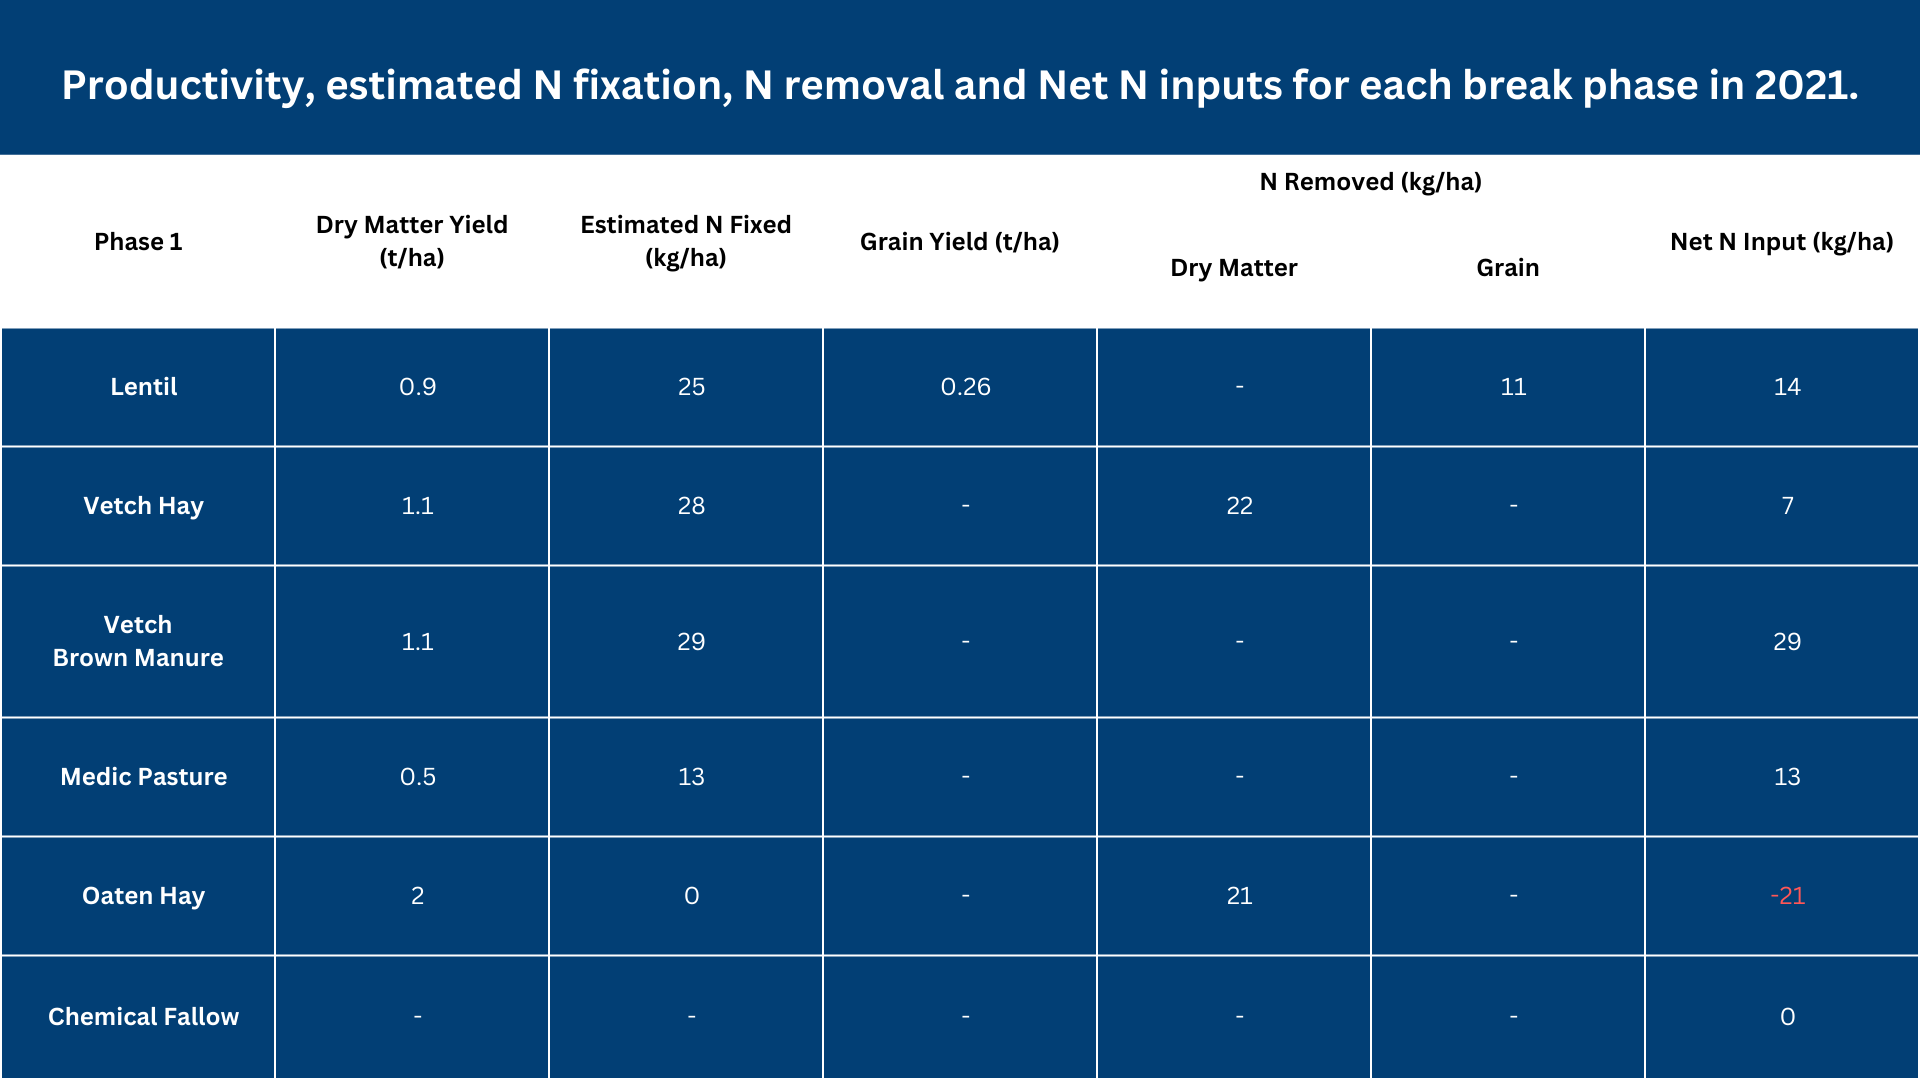
The 2021 season was the driest of the trial years. Crops were sown in early May, however germination was delayed until early June. Delayed emergence limited biomass of vetch and lentils to 1 t/ha, while medic only produced only 0.5 t/ha of dry matter (Table 7). As biomass is the most important driver of N fixation, estimates were only 25-30 kg N/ha for vetch and lentils and just 13 kg N/ha for the medic pasture. Net N inputs in 2021 ranged from -21 kg N/ha for oaten hay to +29 kg/ha for brown manure vetch.
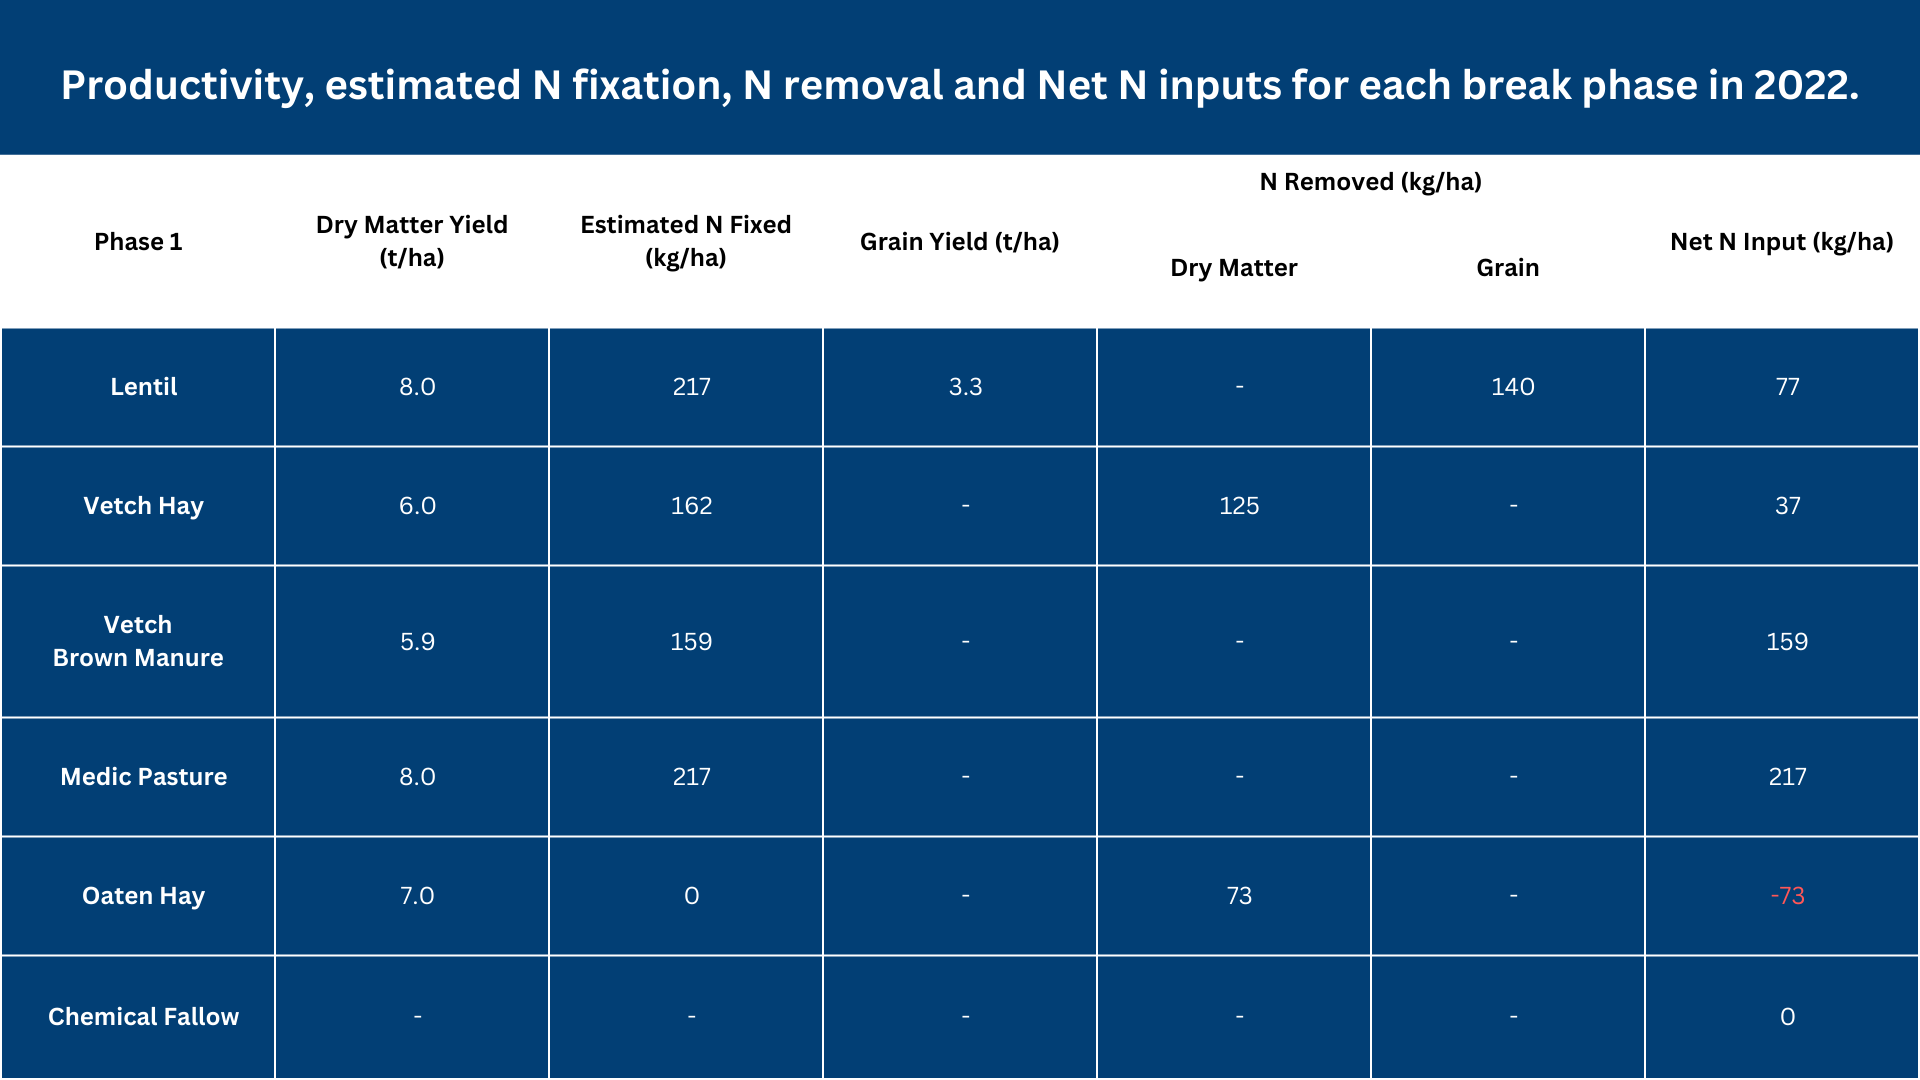
The 2022 season was very wet with 330 mm falling during the growing season. This is double the normal amount of rainfall expected. All crops were sown into excellent soil moisture on the 29th of April. Lentil and medic biomass was 8 t/ha while vetch produced 6 t/ha (Table 8). Vetch biomass was lowest as the brown manure and hay treatments were terminated in September and therefore did not benefit from the high rainfall experienced during October. Lentil grain yield was also high at 3.3 t/ha; however multiple fungicide applications were applied to prevent the development of botrytis grey mould. Estimates N fixation were very high with vetch fixing 160 kg N/ha and lentil and medic more than 200 kg N/ha. However high production also led to high N exports with 125 and 140 kg N/ha removed in the vetch hay and lentil grain respectively. Net N inputs varied between treatments by nearly 300 kg N/ha with the medic pasture contributing +217 kg N/ha while oaten hay exported -73 kg N/ha.
*% N measured for each from 2020 were used to calculate the N yield for each treatment.
Break Phase 2021
Break Phase 2022
Effect of rotation on wheat and barley
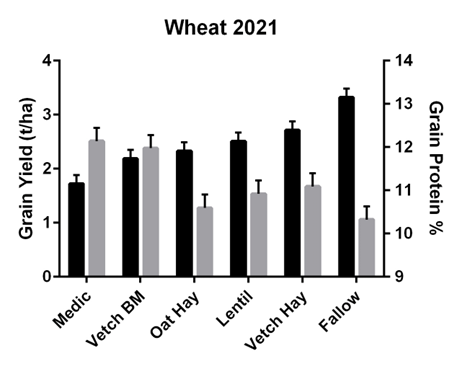
As break phases were first implemented in 2020, the assessment of their impact on subsequent cereal crops in limited to 2021 (wheat only) and 2022 (wheat and barley). The 2020 break phase had a large impact on the grain yield of the 2021 wheat crop (Figure 1) with wheat following fallow producing highest yield 3.3 t/ha and wheat following medic pasture the lowest (2.7 t/ha). Yield differences appeared to be driven by soil water with chemical fallow likely to have more stored soil water than medic which continued grow through the spring of 2020 to establish a regenerating pasture seed bank. Vetch brown manure treatments were also slow to terminate in 2020 and therefore the following wheat crop produced less yield than following vetch that had been cut for hay. The medic and vetch brown manure treatments which had no legume biomass removed in 2020 had approximately 1% higher grain protein than the other break crop treatments. However, some of this increase may have been due to reduced protein dilution as overall there was a trend of higher yielding crops having lower grain protein.
Wheat rotation 2021
The 2021 break crop phase had no effect of the grain yield or grain protein of wheat grown in the wet 2022 season (Figure 2). However, the 2020 break phases had a small impact on the 2022 grain yield and protein of barley grown in 2022 (Figure 2). An additional 300 kg/ha barley was grown following vetch, medic and fallow compared to where lentil and oaten hay was grown two seasons earlier. The brown manure vetch systems also produced higher grain protein levels in the barley than the rotations that included oat hay, lentil and fallow.
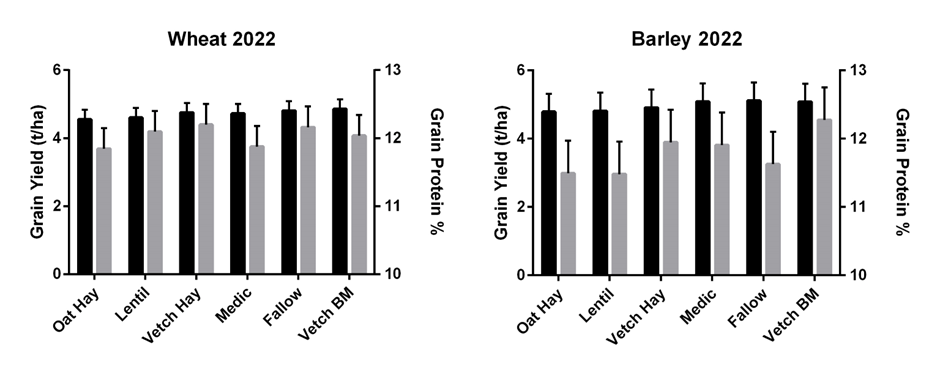
Wheat rotation 2022
Barley rotation 2022
Effect of N rate on wheat and barley
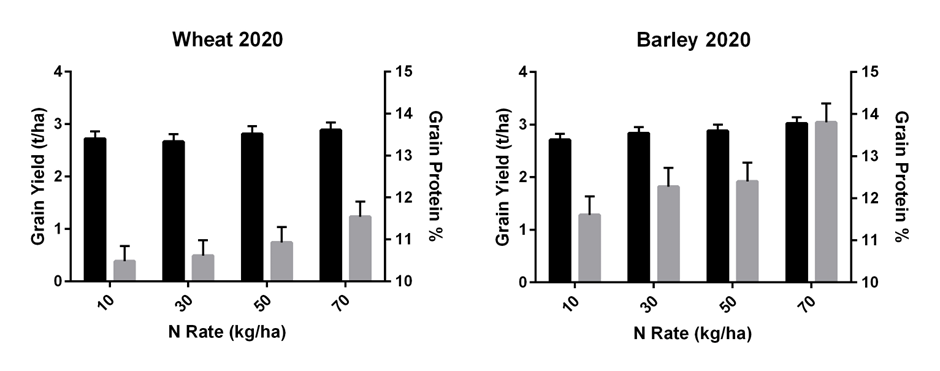
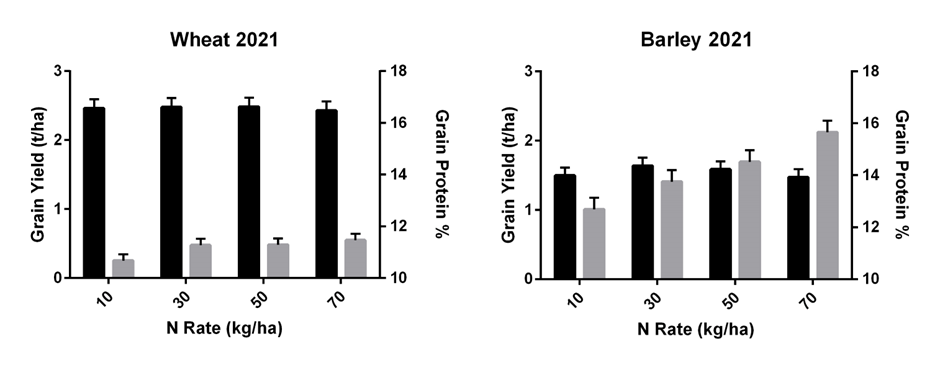
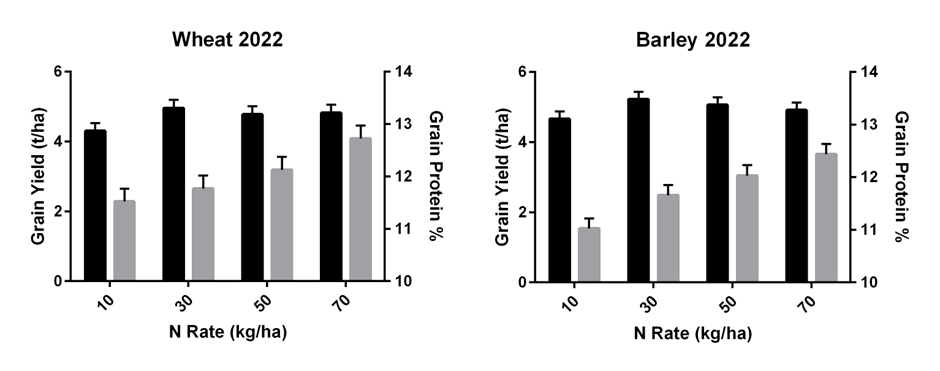
Cereal yield responses to N fertiliser rates were small and inconsistent across seasons (Figure 3). In 2020, higher rates of N slightly improved grain yield with an additional 2.6 kg of wheat grown for each 1 kg of N applied. The rate of return was slightly higher in barley with 4.3 kg of grain grown for each unit of N applied. However, these grain yield responses were small and unlikely to cover the costs of the fertiliser inputs. In the 2021, wheat yield was the same across all N rates while in barley yield was optimised at 30 kg/ha (Figure 4). Application of higher N rates supressed barley yield which indicates slight “haying off” in the drier season. In the wet 2022 season, grain yields of both wheat and barley were increased by approximately 0.5 t/ha after moving from 10 kg N/ha to the 30 kg N/ha rate (Figure 5). Applying N at the two highest rates did not further increase grain yield. Nitrogen fertiliser inputs generally had a greater impact on grain protein than grain yield. There was a linier increase in grain protein in response to N rate across all seasons for both wheat and barley (Figure 3, 4 & 5).
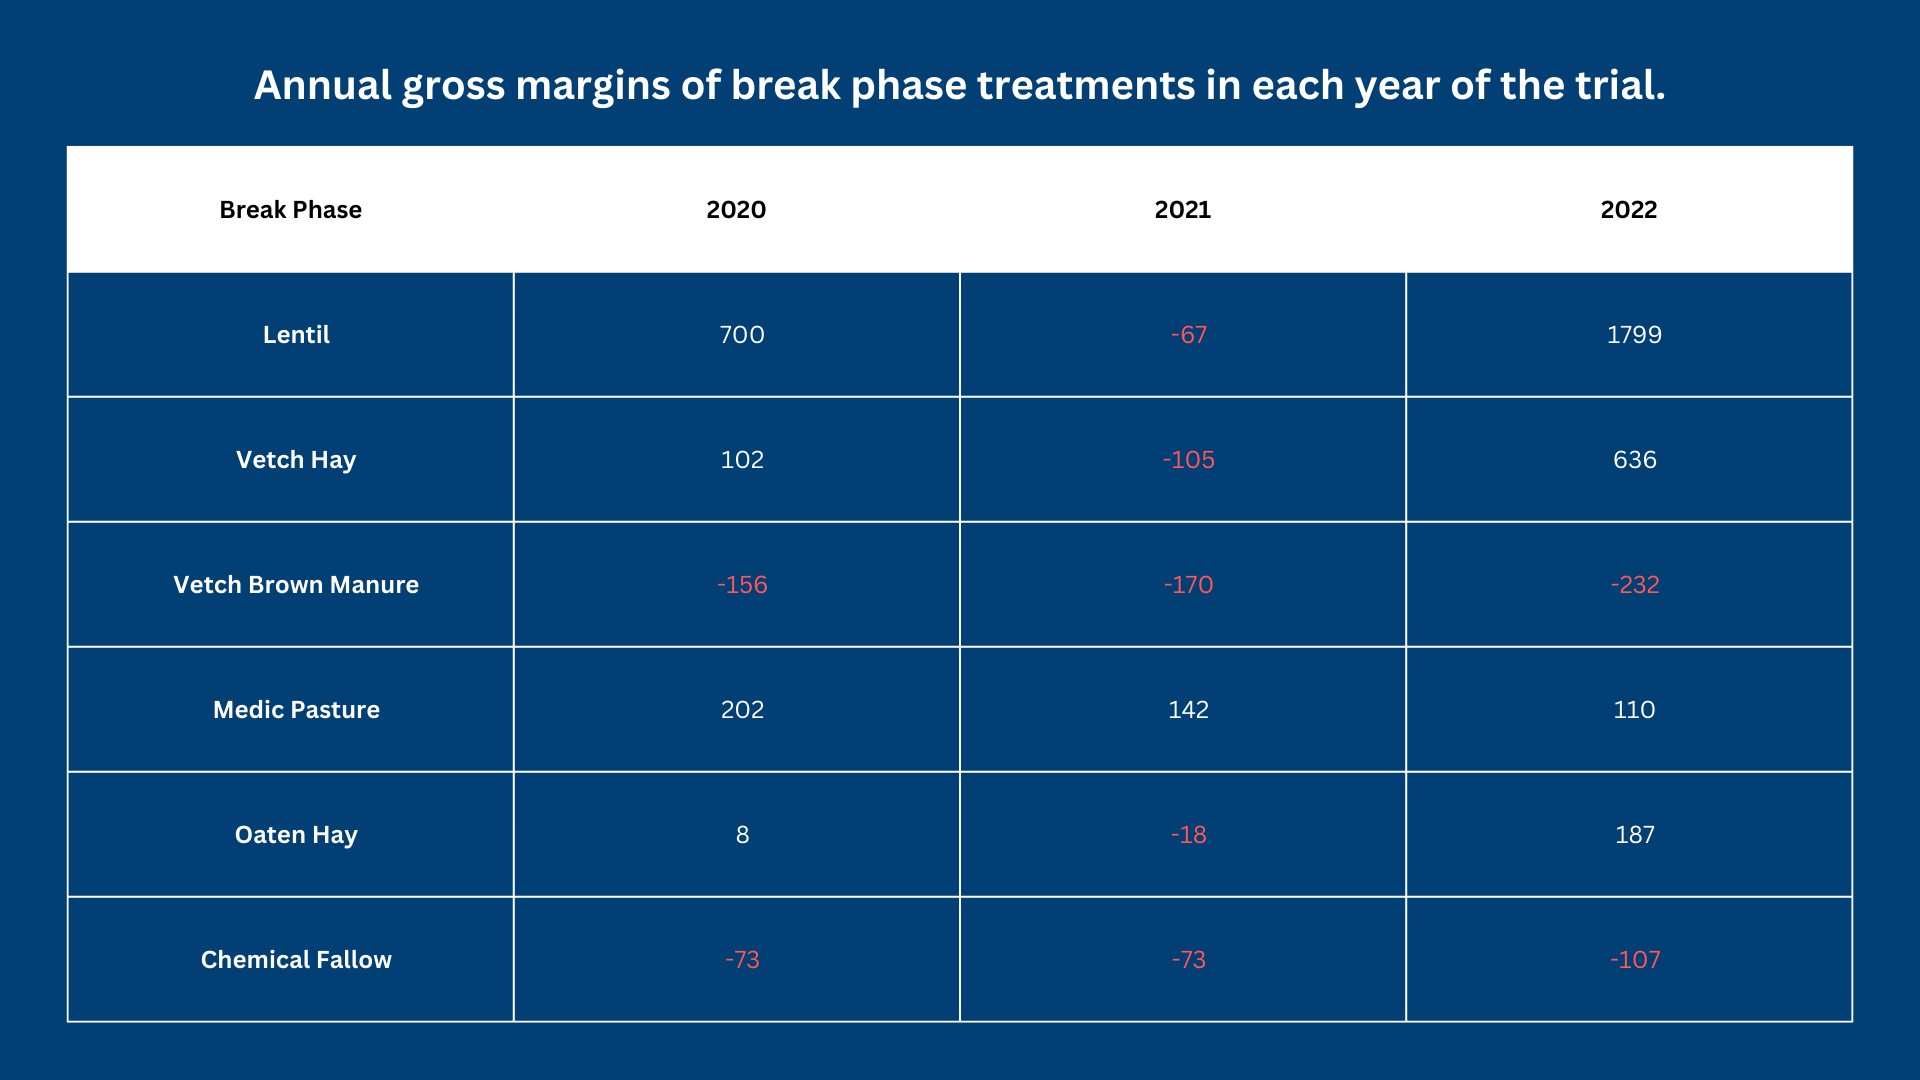
Gross Margins
Lentils produced the highest gross margin of all the break phase options (Table 9). The average on-farm lentil price across the three seasons was $678/t which provided for an extremely high gross margin of $1800/ha in 2023. All break options produced negative gross margins in 2021, except for medic pasture where income from an assumed grazing system was applied. Costs applied to the brown manure vetch system reflected the high level of management applied to that treatment, however it is possible that the brown manure vetch gross margin could be improved by either reducing input costs (e.g. fertiliser inputs, herbicides for weed control) and/or generating income using a grazing system.
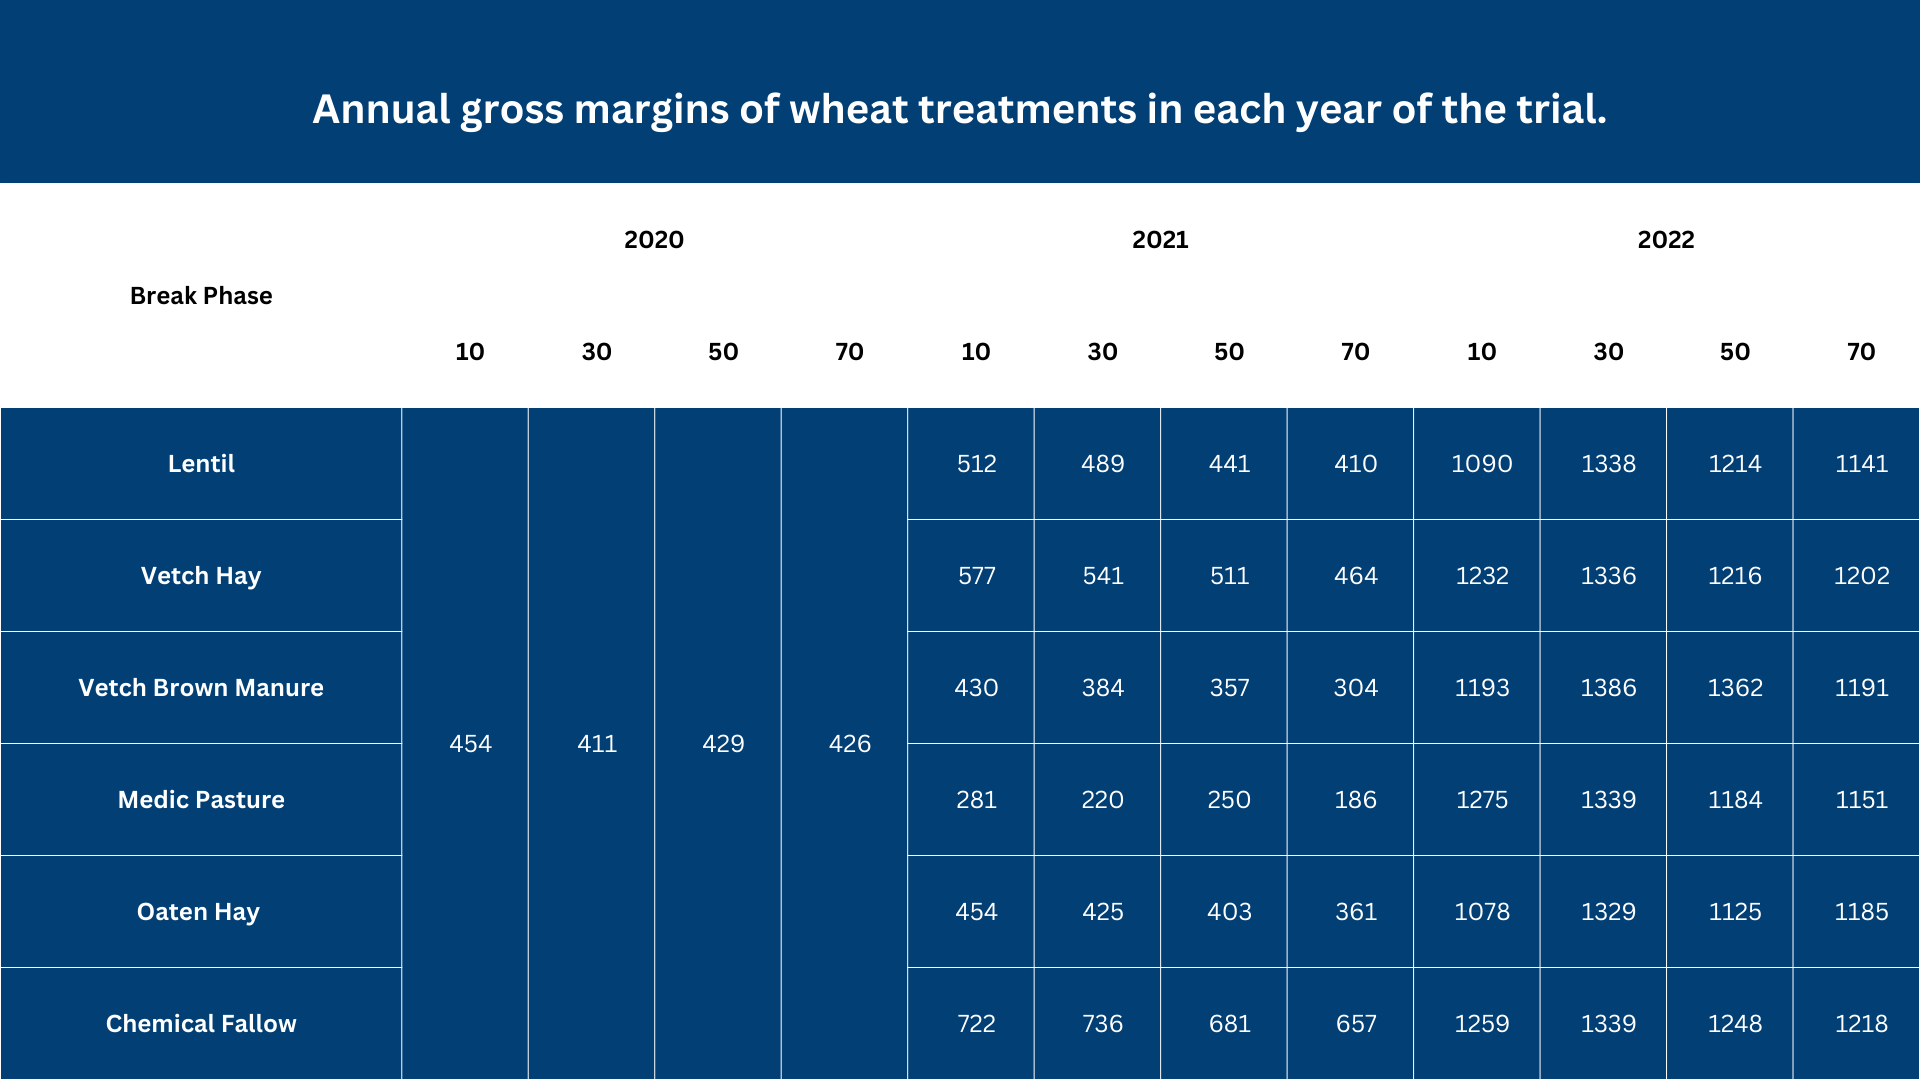
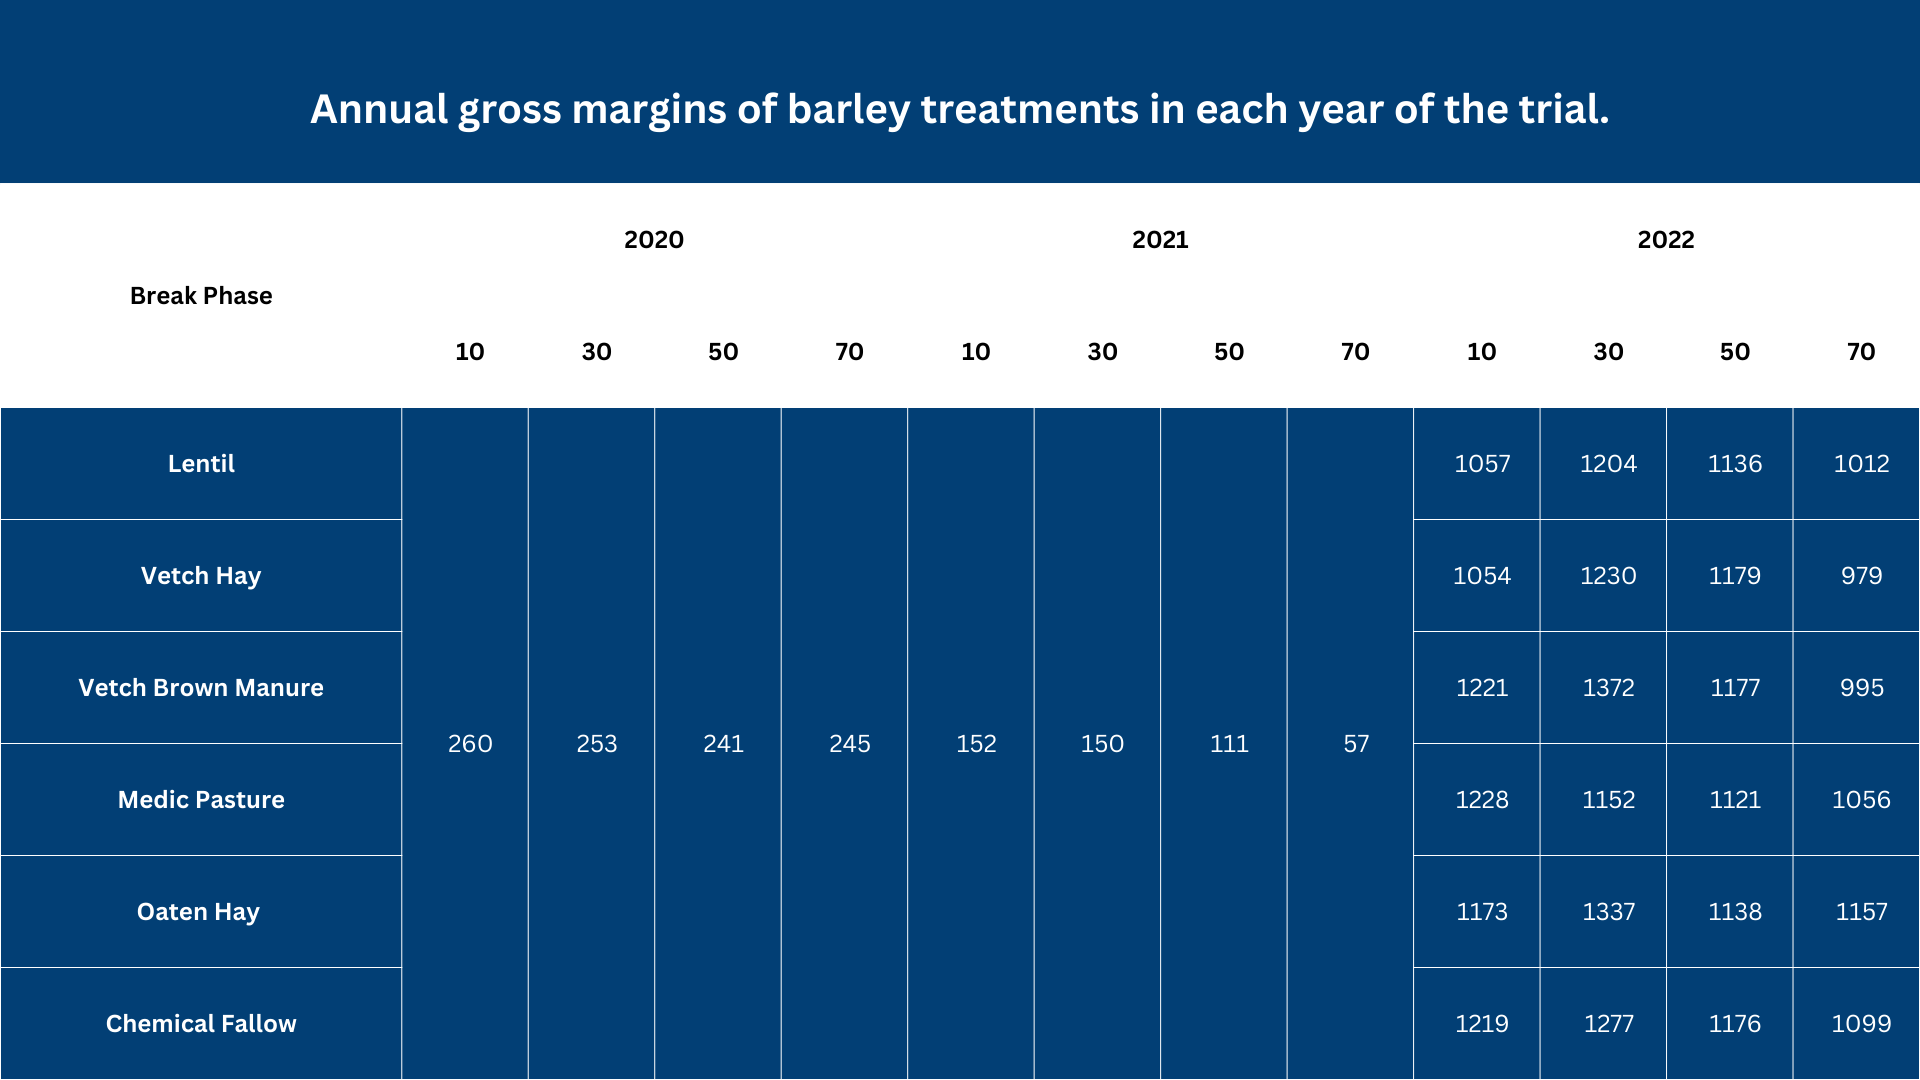
Wheat (Table 10) and barley (Table 11) gross margins also benefited from comparatively high prices across the seasons. The average grain price used to calculate the gross margins for wheat was $308/t and barley $255/t. Barley gross margins were only around $100/ha in 2021, which was following wheat, however wheat grown in 2021 following a break phase in 2020 produced much higher gross margins. The highest gross margin in 2021 was more than $700/ha for wheat following fallow. Both cereal crops produced very high gross margins of more than $1000/ha in 2022.
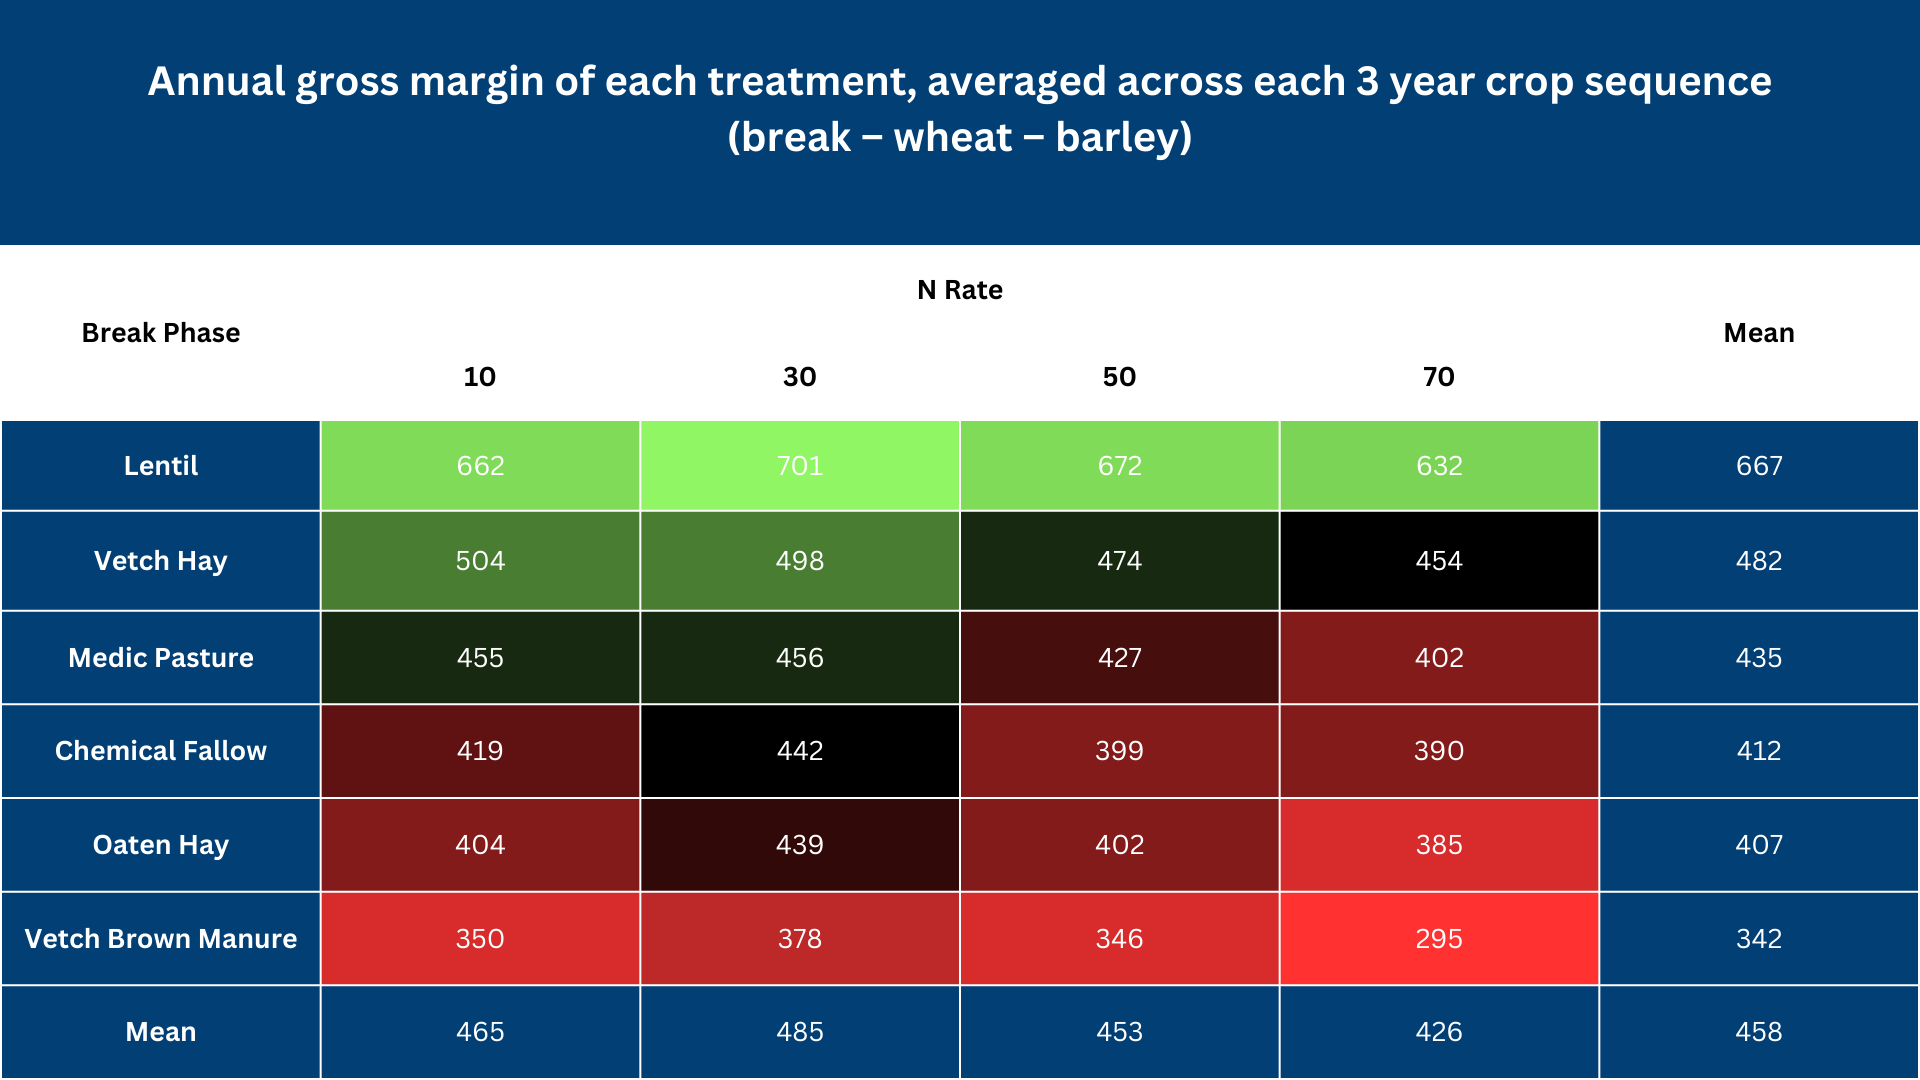
Gross margins were calculated for each break phase x N rate treatment across the entire three-year crop sequence (Table 12). The highest average annual gross margins were produced by rotations that included lentils, with the highest average annual gross margin of 700/ha produced by the treatment with 30 kg N/ha applied during the cereal phase.
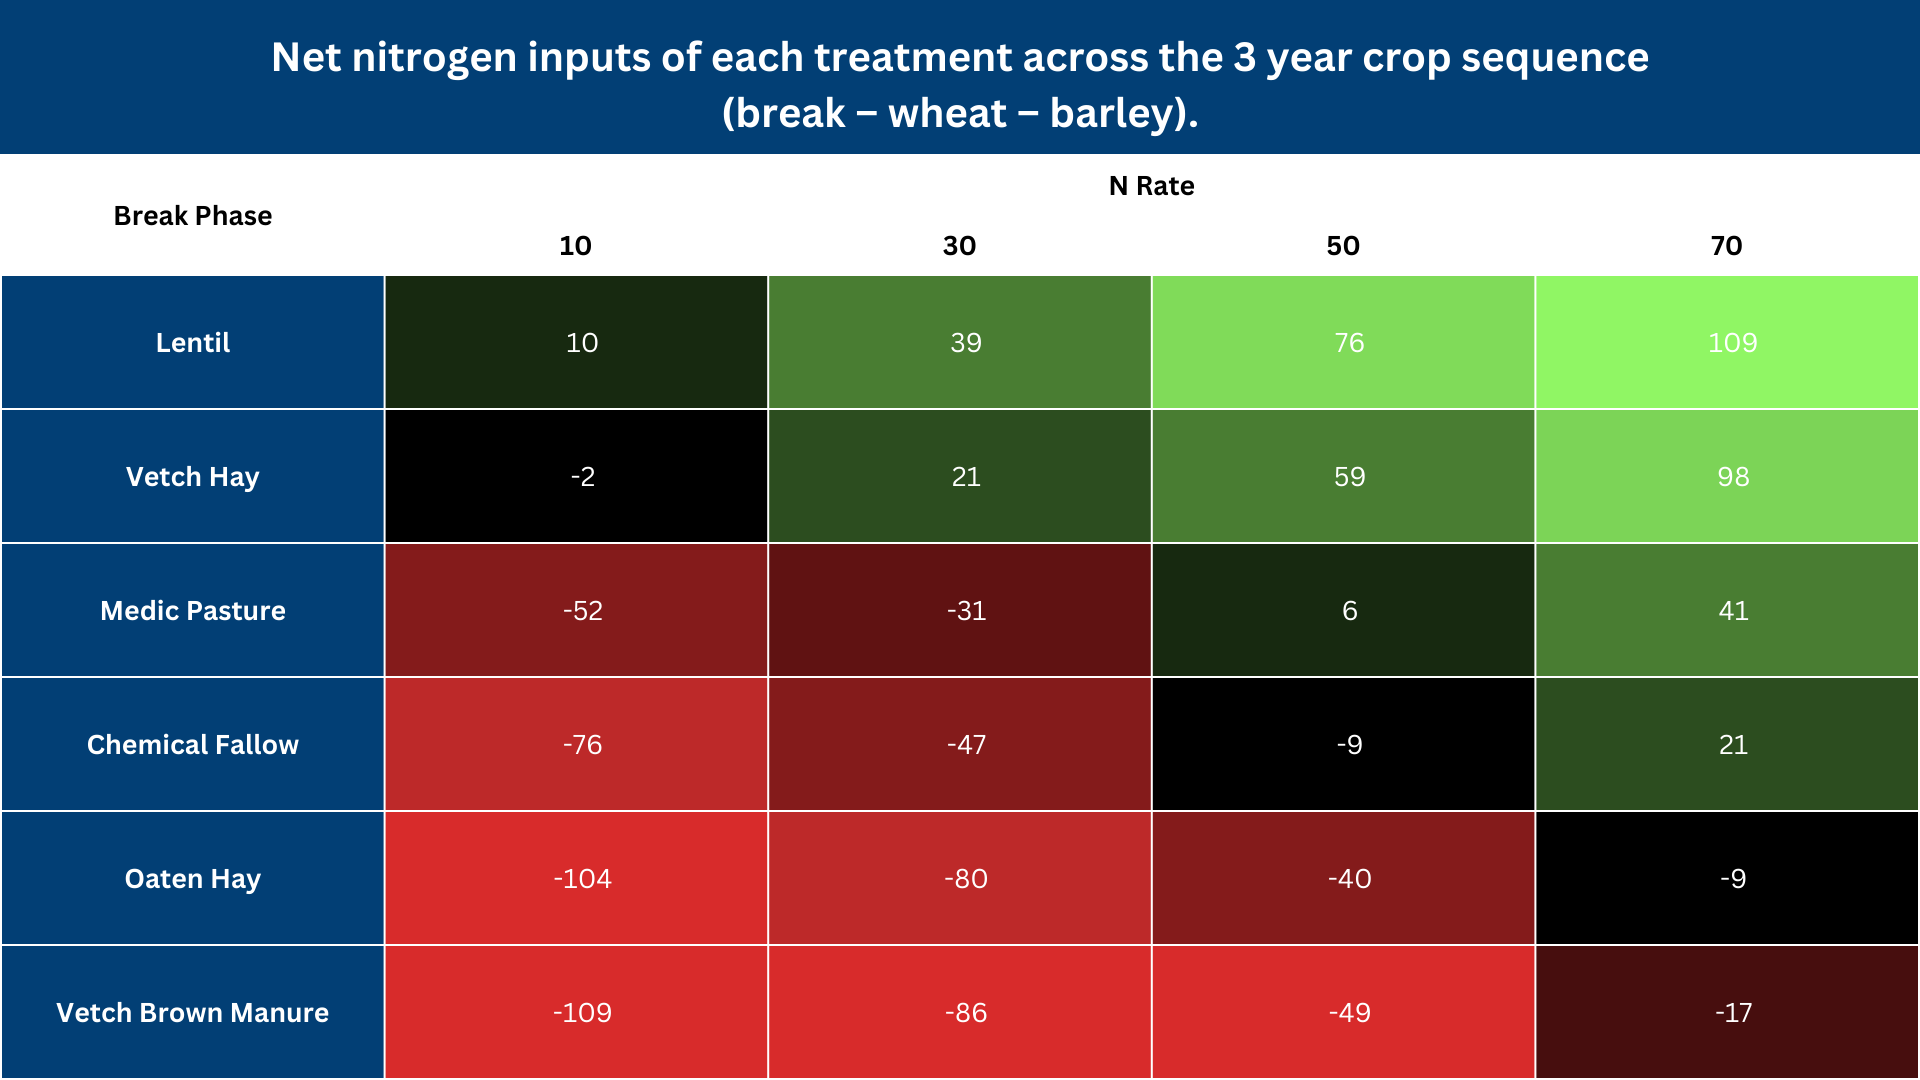
Net N inputs
Net nitrogen inputs were calculated for each treatment across the 3-year cropping sequence (Table 12). Net nitrogen inputs were calculated by accounting for N fixation by legumes, N removed in hay and grain and N applied through fertiliser applications. Neutral net N inputs is desirable to ensure that the soils organic N pool is not mined. Crop sequences with low export legumes systems (brown manure vetch and medic pasture) maintained neutral net N inputs with low N fertiliser rates of 10 kg N/ha applied to the cereal crops. Lentil and vetch hay rotations required 50 kg N/ha to be applied to wheat and barley to balance N inputs with outputs. Sequences with no legume component required at least 70 kg N/ha applied to wheat and barley to maintain a neutral nitrogen balance, with the oaten hay treatment having negative net N input even 70 kg N/ha was applied to the cereal phase.
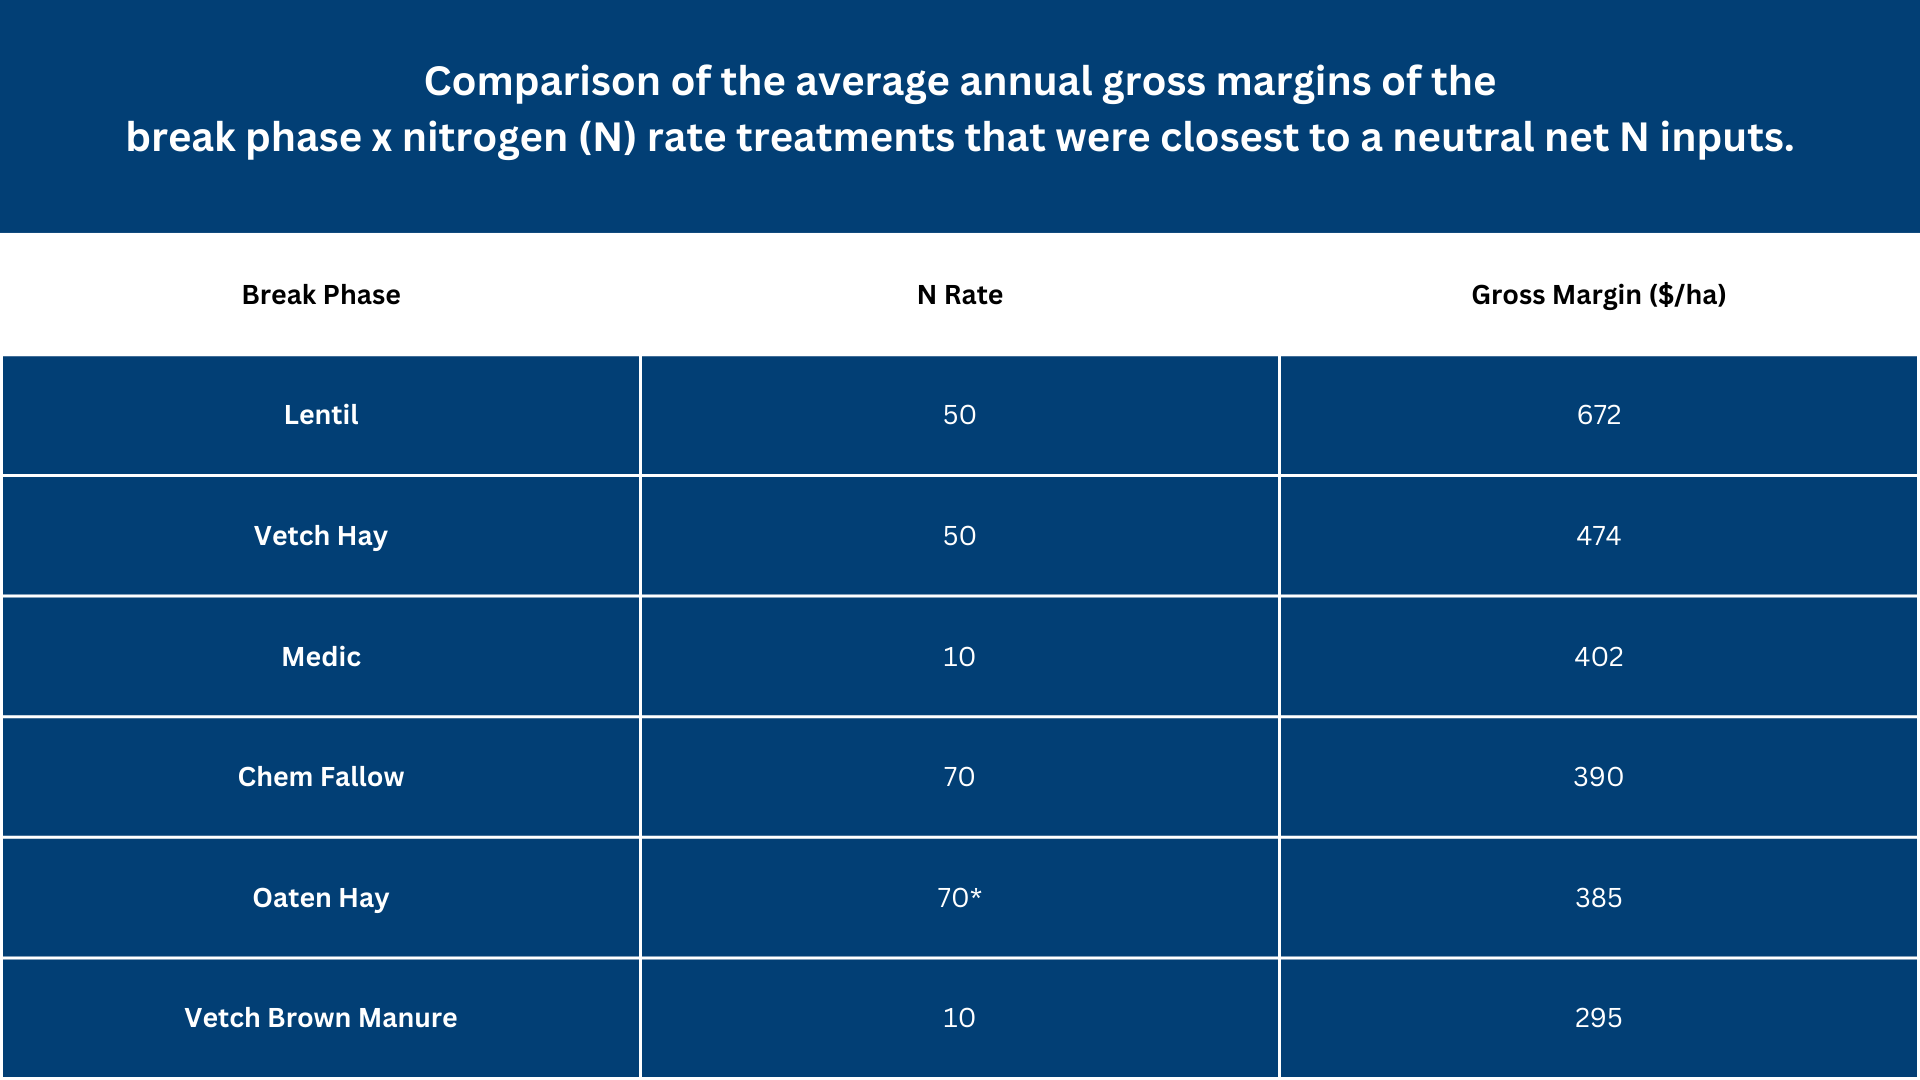
Table 13 summarises the average annual gross margin for each break phase sequence with the N rate treatment which provided the best balance between N inputs and outputs. The lentil rotation with 50 kg N/ha applied was the most profitable treatment with an annual gross margin of $672/ha. This was $200/ha more profitable than vetch hay with equivalent N inputs. Medic with low N inputs had a similar annual gross margin to the chemical fallow and oaten hay rotations with high N inputs applied. The brown manure vetch treatment with low N rates with produced the lowest annal gross margin which at least $100/ha per year lower than all other options.